In the previous section, you had the opportunity to complete a survey which examined questions about your environmental perspectives – your values.
Environmental values surveys are good tools to help understand the perspectives of particular social groups. Figure 1 illustrates the results from such a survey.
This survey suggests that a greater number of Democrat or Independent voters in the USA are concerned about environmental issues than those who vote Republican.
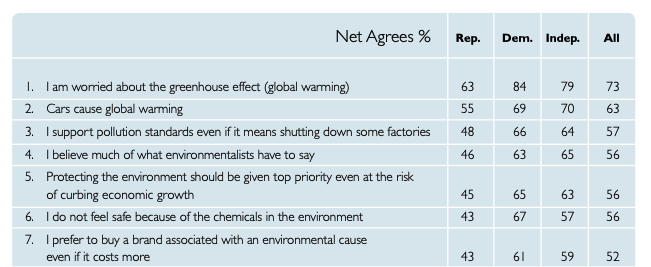
What might that survey tell us about the priorities of a Democratic or a Republican administration?
So how do you make a Values Survey?
The starting point is deciding what information you want to find out and why as a research question. So you might want to find out what Students in a DP programme in Mumbai feel about the problems of atmospheric pollution and how it affects them compared to say DP students in Malmo Sweden.
You now have a RESEARCH QUESTION. But to answer the question you are going to have to ask some people. You could do this through an interview, but interviews are very hard to turn into data so often we would choose to create a survey with a range of questions – a questionnaire.
Table 1. A checklist for designing a Survey Study after Creswell and Creswell 2018
| A Checklist of Questions for Designing a Survey Study Plan | |
| Is the purpose of a survey design stated? | |
| What type of design will be used and what are the reasons for choosing the design mentioned? (types: mail, telephone, the Internet, personal interviews, or group administration) | |
| Is the nature of the survey (cross-sectional – single time point vs. longitudinal – over a period of time) identified? | |
| Is the population and its size mentioned? | |
| Will the population be stratified? (e.g. based on gender, or age, or nationality etc) | |
| If so how? | |
| How many people will be in the sample? | |
| On what basis was this size chosen? | |
| What will be the procedure for sampling these individuals (e.g. random, nonrandom)? | |
| What instrument will be used in the survey? Google forms, survey monkey, pen and paper question sheets etc – justify your choice. | |
| Will the survey be subject to a pilot or field-test? | |
| What is the timeline for administering the survey? | |
| How will the measures be scored and converted into variables? | |
| How will the variables be used to test your research questions? |
Creswell, J.W. and Creswell, J.D. (2018) Research design: qualitative, quantitative, and mixed methods approaches. Fifth edition. Los Angeles: SAGE.
What type of questions?
As you have seen above and in the previous section, the questions usually ask the person completing the survey to make a judgement. These judgments can either be questions that rank responses or rate responses.
Rank
Respondents compare items to each other by placing them in order of preference. So if I was interested in asking about favourite deserts then I could ask the interviewees to rank their preference of Ice Cream, Yoghurt, Cake and Chocolate.
Rate
Respondents assign numerical values to answers along a scale. So I could ask the interviewers instead to Choose on a scale of 1 – 5 how much they like Ice Cream, 1 being not at all, 5 being very much.
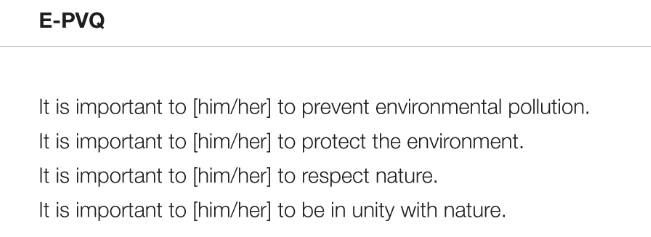
Figure 2 has some sample questions from a research article (which you can access from the link) about how to measure Values in Environmental research. How would you use these questions, would they be Ranked or Rated?
Both types of questions have strengths and weaknesses and need to be able to provide you with data you can analyse based on your Research question. Websites which allow you to make surveys have a lot of information about how to create good online surveys. They make a good starting point for thinking about your survey design, BUT, a good survey can only come from having a focused Research Question and spending time about what data you really need to answer that question.
Some resources to help you think about value surveys.
The American Climate & Environmental Values Survey 2011, contains a very good summary report about the attitudes of Americans to climate and environmental concerns. The report is a pdf link and contains all the questions asked. You can use this to model how a major piece of research asked value questions and how the interpreted the answers. NB More on that in a later section about statistics in ESS
https://climateaccess.org/resource/american-climate-environmental-values-survey
The Atlas of European Values takes the data from the European Values Survey and presents it as a set of maps. This is a useful site to see how researchers use cartographic techniques – maps that make sense of something – to display survey data. This is a useful technique that you can use in ESS IAs and EEs to display data. There are also a lot of other resources about the European values survey on the site, beyond environmental values. The first link is the interactive maps second link is the home page.