Ecological pyramids are visual models that show the relative importance of different trophic levels in an ecosystem. They help illustrate the structure of food chains and how energy and biomass move through ecosystems.
There are three main types of ecological pyramids:
- Pyramid of Numbers
- Pyramid of Biomass
- Pyramid of Energy
1. Pyramid of Numbers
- Represents the number of organisms at each trophic level per unit area.
- Each bar’s length shows how many organisms are at that level.
- Producers form the base, followed by primary consumers, secondary consumers, and so on.
- Decomposers and parasites are often placed to the side.

Pyramid of Numbers for a grassland
Limitations:
- Difficult to count organisms like grasses or algae individually.
- Does not consider organism size (a bacterium counts the same as a whale).
- Can appear inverted — e.g., few trees supporting many herbivorous insects.
- The shape changes at different times of year.

Inverted Pyramid for a European Oak Tree
2. Pyramid of Biomass (gm-2, gm-2 yr)
- Shows the total dry mass of organisms at each trophic level.
- Reflects the amount of living material rather than the number of organisms.
- Gives a more realistic picture than numbers, but has its own problems.

Pyramid of biomass for a area of scrubland
Limitations:
- Biomass accumulates over different time periods — e.g., trees store biomass for centuries, while algae renew biomass in days.
- Fluctuations in biomass (especially in algae) change the pyramid shape over time.
- Marine and freshwater pyramids can appear inverted, where zooplankton and fish outweigh phytoplankton
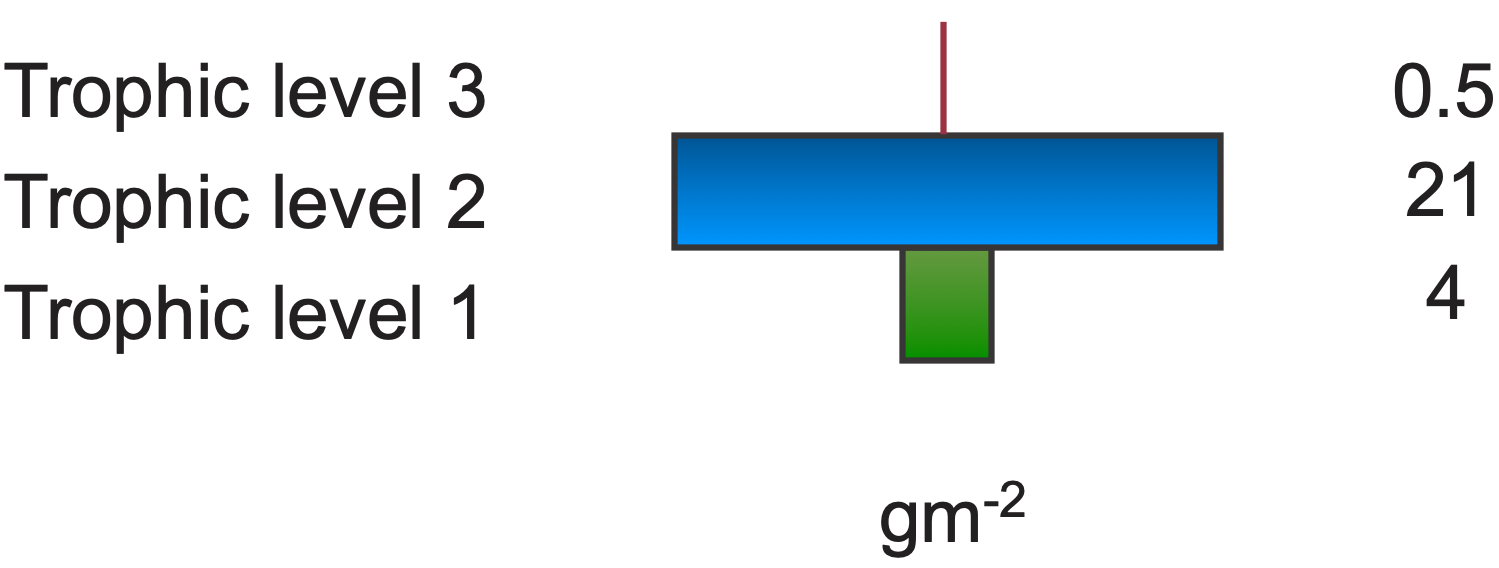
Inverted Pyramid of Biomass for an aquatic ecosystem
Explanation for Inversion:
- Phytoplankton reproduce and are consumed rapidly (short life cycle).
- Although small at any moment, their annual biomass production exceeds that of consumers.
3. Pyramid of Energy
- Measures the flow of energy through each trophic level over a year.
- Overcomes the limitations of number and biomass pyramids.
- Energy is expressed in kilojoules per square metre per year (kJ m⁻² yr⁻¹).

Pyramid of Energy
Key Points:
- Energy values depend on the chemical composition of organisms.
- Carbohydrates and proteins: ~17 kJ g⁻¹
- Fats: ~37 kJ g⁻¹
- Energy pyramids are always upright because energy decreases with each trophic transfer (due to heat loss and metabolic use).